Why Watson?
Unlike live debugging, postmortem debugging often can take more time to analyze and sometime not successful if the dump is not right.
Even worse, Watson dump can take longer than full dump since its content is generally limited.
However, the value of Watson dump is that it often contains the real crash situation the customers encountered, which normally we never reproduce in the lab.
Setting up debugger (WinDbg)
1) First thing we need to do is to setup the debugger -in this article, WinDbg.
Go to Microsoft Download Center and install latest Debugging Tools for Windows.
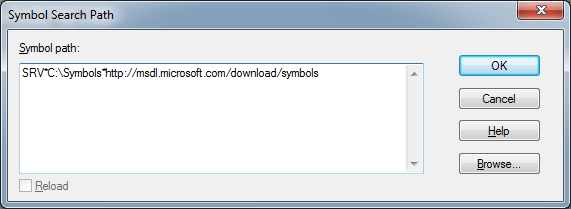
2) Next thing we have to set Symbol server path. There are several ways to set symbol path. I prefer to set symbol path into Windbg base workspace so that all other workspaces inherits the symbol path.
In order to do that, run windbg.exe (with no args) in elevated cmd prompt and click File->Symbol File Path. Set path below.
3) Click File->Save Workspace.
Opening Watson Dump
In order to open Watson dump with WinDbg, I typically use the following -z command.
C> windbg -z memory.hdmp
Once it’s open, the following information is shown. It’s basically saying the dump contains limited information,
the server where dump generated is 4 CPU Win2008 x86, and the cause of crash was stack buffer overflow.
Using !analyze –v
Using !analyze –v is usually good start. This command is developed by MS Research.
I think it generally provides valuable where-to-start information.
Call stack investigation
Management Tools are heavily using C# managed code. In order to look at Managed Call Stack, we have to use SOS debugger extension.
SOS comes with .NET framework, if you have .NET installed (of course), you don’t have to install anything.
(There is another my favorite debugger extension is SOSEX, but let’s focus on SOS)
To load SOS debugger extension,
0:00> .loadby SOS mscorworks (CLR 2.0)
0:00> .loadby SOS clr (CLR 4.0)
I prefer to reduce typing. So I copied sos.dll from .NET framework folder (under Windows) to C:\Debuggers so that I simply type:
0:00> .load sos
Since we don’t know where the error occurred from, we generally investigate both Native and Managed Call Stack.
For Native call stack, my favorite command is kp (or kP) which automatically interprets parameters and source lines.
Here is an example:
0:00> kp
….
098ef14c 7571898e user32!InternalCallWinProc(void)+0x23 [d:\longhorn\windows\core\ntuser\client\i386\callproc.asm @ 106]
098ef1c4 75718ab9 user32!UserCallWinProcCheckWow(struct _ACTIVATION_CONTEXT * pActCtx = 0x00000000,
098ef228 75718b10 user32!DispatchMessageWorker(struct tagMSG * pmsg = 0x06fa095a, int fAnsi = 0n0)+0x380 [d:\longhorn\windows\core\ntuser\client\clmsg.c @ 2440]
098ef238 0689510e user32!DispatchMessageW(struct tagMSG * lpMsg = 0x098ef2c4)+0xf [d:\longhorn\windows\core\ntuser\client\cltxt.h @ 971]
098ef254 6e0b8d2e CLRStub[StubLinkStub]@2b0e2400689510e(
098ef308 6e0b8997 System_Windows_Forms_ni!System.Windows.Forms.Application+ComponentManager.System.Windows.Forms.UnsafeNativeMethods.IMsoComponentManager.FPushMessageLoop(
098ef360 6e0b87e1 System_Windows_Forms_ni!System.Windows.Forms.Application+ThreadContext.RunMessageLoopInner(
098ef390 6e5cde2b System_Windows_Forms_ni!System.Windows.Forms.Application+ThreadContext.RunMessageLoop(
098ef3a8 6e6025ab System_Windows_Forms_ni!System.Windows.Forms.Application.RunDialog(
098ef434 6e6027c3 System_Windows_Forms_ni!System.Windows.Forms.Form.ShowDialog(
098ef468 6f16274a System_Windows_Forms_ni!System.Windows.Forms.Form.ShowDialog(
098ef468 70116e96 SqlMgmt_ni!Microsoft.SqlServer.Management.SqlMgmt.RunningFormsTable+RunningFormsTableImpl+ThreadStarter.StartThread(
098ef474 7012031f mscorlib_ni!System.Threading.ThreadHelper.ThreadStart_Context(
098ef488 70116e14 mscorlib_ni!System.Threading.ExecutionContext.Run(
….
To get Managed Call Stack, once we load SOS, use “ClrStack –a”
0:00> clrstack –a
…
098ef39c 6e5cde2b System.Windows.Forms.Application.RunDialog(System.Windows.Forms.Form)
PARAMETERS:
form =
098ef3b0 6e6025ab System.Windows.Forms.Form.ShowDialog(System.Windows.Forms.IWin32Window)
PARAMETERS:
this = 0x032cf95c
owner =
LOCALS:
0x098ef410 = 0x00000000
0x098ef40c = 0x00000000
0x098ef3dc = 0x00000000
098ef43c 6e6027c3 System.Windows.Forms.Form.ShowDialog()
PARAMETERS:
this =
098ef440 6f16274a Microsoft.SqlServer.Management.SqlMgmt.RunningFormsTable+RunningFormsTableImpl+ThreadStarter.StartThread()
PARAMETERS:
this = 0x032ce1a0
LOCALS: <CLR reg>
098ef470 70116e96 System.Threading.ThreadHelper.ThreadStart_Context(System.Object)
PARAMETERS:
state =
LOCALS:
…
Sometimes, we need to dig into local variables or parameters by using command such as dumpobj, dumpvc, dumparray.
Say for example, we can investigate 0x032cf95c by using !dumpobj (!do for short).
Now we know that MaintenancePlanWizardForm was launched from SSMS.
0:009> !do 0x032cf95c
Name: Microsoft.SqlServer.Management.MaintenancePlanWizard.MaintenancePlanWizardForm
MethodTable: 66438a04
EEClass: 6639483c
Size: 568(0x238) bytes
(E:\Program Files (x86)\Microsoft SQL Server\100\Tools\Binn\VSShell\Common7\IDE\Microsoft.SqlServer.Management.MaintenancePlanWizard.dll)
098ee844 6e09f435 System.Windows.Forms.ButtonBase.OnPaint(System.Windows.Forms.PaintEventArgs)
PARAMETERS:
this = 0x033bbb8c
pevent = 0x035ef130
0:009> !do 0x033bbb8c
Name: System.Windows.Forms.RadioButton
MethodTable: 6e0f6478
EEClass: 6debc0d0
Size: 168(0xa8) bytes
(C:\Windows\assembly\GAC_MSIL\System.Windows.Forms\2.0.0.0__b77a5c561934e089\System.Windows.Forms.dll)
Fields:
MT Field Offset Type VT Attr Value Name
70170b54 4001130 20 System.String 0 instance 033bc774 text
0:009> !do 033bc774
Name: System.String
MethodTable: 70170b54
EEClass: 6ff2d65c
Size: 138(0x8a) bytes
(C:\Windows\assembly\GAC_32\mscorlib\2.0.0.0__b77a5c561934e089\mscorlib.dll)
String: All &user databases (excluding master, model, msdb, tempdb)
In order for SOS help, you can simply type !sos.help in windbg or visit http://msdn.microsoft.com/en-us/library/bb190764.aspx.

