bp command can be used with "user defined command." So everytime the breakpoint is hit, we can run some commands accordingly.
Let's take an example. Let's say, whenever LoadLibrary() function is called, we want to display its parameter (which is libraray dll name).
(1) First, we have to set breakpoint on LoadLibrary. Whenevery the library is called, we will do something... LoadLibrary() function is in kernel32.dll. One thing to note is that LoadLibrary is actually win32 macro, so there is no actual library in binary DLL level. It is converted to actual function name (LoadLibraryW or LoadLibraryA) depending on ANSI/Unicode.
0:000> bp kernel32!LoadLibraryW
(2) Now, to do some actions, we add multiple commands separated by semi-colon and have the commands enclosed by double quotations.
syntax : "command1; command2; command3"
Here is an example of displaying first parameter for LoadLibraray() function.
0:000> bp kernel32!LoadLibraryW ".echo *****;du dwo(esp+4);k;g;"
- .echo command display any text.
- du command display any Unicode string from the specified address.
- dwo() function returns double word value from the specified address.
- esp is ESP register that contacts current stack pointer.
- k is to show callstack to see who is calling this function. This one is just optional.
- g command make the debugger keep running.
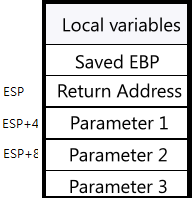
Let's look at the stack a little further. Whenever a function is called, that is whenever assembly language 'call' command is executed, 'return address' is automatically saved after parameters in the stack. When a breakpoint is occurred at the beginning of the function, stack pointer is pointing to 'return address.' So the first parameter memory address at the breakpoint time is stackpointer (esp) + 4 bytes location.
 |
| Stack State when a func is called |
If looking at the result of kb command (display call stack with 3 params) at the breakpoint, the address in ChildEBP points the "Saved EBP." even if previous EBP is not saved yet (explained later). RetAddr is the value of 0008eb38+4 memory address. Args to Child are the actual parameter values which are located at 0008eb38+8, 0008eb38+C, 0008eb38+0x10. LoadLibraryW only has one parameter, so actually meaningfyl parameter is first parameter only for this function.
0:000> kb
ChildEBP RetAddr Args to Child
0008eb38 76eacf0e 0008eb48 76f10718 003a0043 kernel32!LoadLibraryW
0008ed54 76eab8b3 0008f4dc 0008f420 00000001 USER32!User32InitializeImmEntryTable+0xffa
0008f40c 776f9950 76e90000 00000001 0008f714 USER32!UserClientDllInitialize+0x1c6
0008f42c 776fd8c9 76eab6ed 76e90000 00000001 ntdll!RtlQueryEnvironmentVariable+0x241
0008f520 7770681c 0008f714 7efdd000 7efde000 ntdll!LdrResSearchResource+0xb4d
0008f6a0 777052d6 0008f714 776c0000 77efe3a9 ntdll!RtlGetNtVersionNumbers+0x9b
0008f6f0 776f9e79 0008f714 776c0000 00000000 ntdll!RtlSetUnhandledExceptionFilter+0x50
0008f700 00000000 0008f714 776c0000 00000000 ntdll!LdrInitializeThunk+0x10
When a function is called, the first thing the function does is to save previous EBP and reset stack pointer (ESP) to EBP. This is done by three assembly instructions as you can see below. When this instructions are done, EBP and ESP point to the same address and all local vairables are pushed on top of the stack.
0:000> u .
kernel32!LoadLibraryW:
75a548fb 8bff mov edi,edi
75a548fd 55 push ebp
75a548fe 8bec mov ebp,esp