Thread Stack
Each thread has two stacks – one stack for kernel mode and the other for user mode. Where can we find those stacks? Well, let’s quickly take a look.First, run Calc.exe and attached debugger (my favorite Windbg) to the Calc process. Once the debugger is attached, switch thread to 0 and run !teb to display Thread Environment Block(TEB). By looking at TEB, we can figure out the user mode stack area.
0:004> ~0s
eax=0012ed84 ebx=00000000 ecx=0012ed84 edx=779764f4 esi=0012ed84 edi=77399442
eip=779764f4 esp=0012ec80 ebp=0012ec9c iopl=0         nv up ei pl zr na pe nc
cs=001b  ss=0023  ds=0023  es=0023  fs=003b  gs=0000             efl=00000246
ntdll!KiFastSystemCallRet:
779764f4 c3              ret
0:000> !teb
TEB at 7ffdf000
ExceptionList:        0012fa98
    StackBase:            00130000
    StackLimit:           0012a000
SubSystemTib:         00000000
FiberData:            00001e00
ArbitraryUserPointer: 00000000
Self:                 7ffdf000
EnvironmentPointer:   00000000
……
In TEB above, we see there is user mode stack base and upper limit of the stack. That is, the stack ranges from 0x00130000 – 0x0012a000 (stack grows from high to low memory).Secondly, then how can we find kernel mode stack? As you guess, we have to use (local) kernel debugger to find that out. Let’s see local kernel debugger to get this handy. In order to get thread object address, !process command was used as follows.
lkd> !process 0 4 calc.exe
PROCESS 86ac47e8  SessionId: 1  Cid: 0558    Peb: 7ff
DirBase: ce18ea00  ObjectTable: a3b59140  HandleC
Image: calc.exe
THREAD 85b92938  Cid 0558.1db8  Teb: 7ffdf000
THREAD 85cf19b0  Cid 0558.1768  Teb: 7ffdd000
THREAD 86b3f128  Cid 0558.1a3c  Teb: 7ffdc000
THREAD 880b1d48  Cid 0558.1bf0  Teb: 7ffdb000
THREAD 871c05c8  Cid 0558.1e90  Teb: 7ffda000
Once the thread object (85b92938 ) is found, the kernel thread block (_KTHREAD) can be displayed with dt command. Bold-face part shows initial stack, max limit and current stack position (KernelStack at 0x30).
lkd> dt nt!_KTHREAD 85b92938
+0x000 Header           : _DISPATCHER_HEADER
+0x010 CycleTime        : 0x14b1bef8
+0x018 HighCycleTime    : 0
+0x020 QuantumTarget    : 0x174fbc90
   +0x028 InitialStack     : 0x8f7f0fd0 Void
   +0x02c StackLimit       : 0x8f7ee000 Void
   +0x030 KernelStack      : 0x8f7f09b0 Void
+0x034 ThreadLock       : 0
……
+0x086 SpecialApcDisable : 0n0
+0x084 CombinedApcDisable : 0
   +0x088 Teb              : 0x7ffdf000 Void
+0x090 Timer            : _KTIMER
……
KTHREAD also includes TEB pointer information, so we can query the TEB with its address.
lkd> !teb 0x7ffdf000
TEB at 7ffdf000
ExceptionList:        00078914
 StackBase:            00080000
    StackLimit:           00069000
SubSystemTib:         00000000
FiberData:            00001e00
ArbitraryUserPointer: 00000000
Self:                 7ffdf000
EnvironmentPointer:   00000000
ClientId:             00000ea8 . 0000131c
RpcHandle:            00000000
Tls Storage:          7ffdf02c
PEB Address:          7ffd6000
LastErrorValue:       0
LastStatusValue:      c0000139
Count Owned Locks:    0
HardErrorMode:        0
If we compare this TEB output with user mode TEB data, we find something wrong. This is because TEB data is located in user address space, not kernel address space. So to retrieve correct thread data, we have to set thread context and prepare physical memory before access (by using .thread command).
lkd> .thread /p /r 85b92938
Implicit thread is now 85b92938
Implicit process is now 86ac47e8
Loading User Symbols
................................
lkd> !teb 0x7ffdf000
TEB at 7ffdf000
ExceptionList:        0012fa98
 StackBase:            00130000
    StackLimit:           0012a000
SubSystemTib:         00000000
FiberData:            00001e00
ArbitraryUserPointer: 00000000
Self:                 7ffdf000
EnvironmentPointer:   00000000
ClientId:             00000558 . 00001db8
RpcHandle:            00000000
Tls Storage:          7ffdf02c
PEB Address:          7ffde000
LastErrorValue:       0
LastStatusValue:      c0150008
Count Owned Locks:    0
HardErrorMode:        0
Plesae note that the thread object (ex:85b92938) points to an executive thread block (ETHREAD) which includes its kernel thread block (KTHREAD) as its first member of the ETHREAD structure. KTHREAD contains TEB pointer in its structure.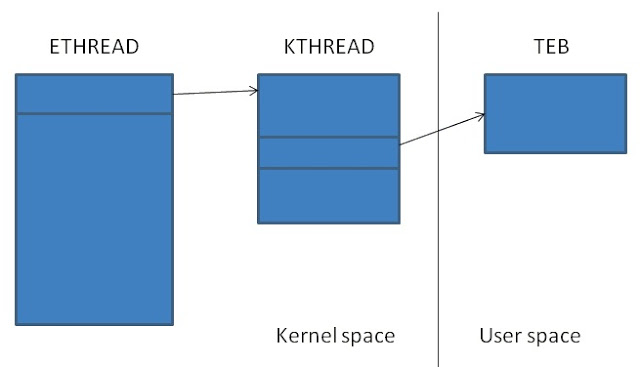
By the way, another easy way to discover kernel thread stack is to simply use !thread command. In the middle of the output below, there is kernel stack information. And as seen below, ChildEBP addresses are all within kernel stack range.
lkd> !thread 85b92938
THREAD 85b92938  Cid 0558.1db8  Teb: 7ffdf000 Win32Thread: fe5a34f8 WAIT: (Suspended) KernelMode Non-Alertable
SuspendCount 1
FreezeCount 1
85b92b00  Semaphore Limit 0x2
Not impersonating
DeviceMap                 bf992858
Owning Process            86ac47e8       Image:         calc.exe
Attached Process          N/A            Image:         N/A
Wait Start TickCount      13525527       Ticks: 79995 (0:00:20:47.929)
Context Switch Count      1580
UserTime                  00:00:00.031
KernelTime                00:00:00.078
Win32 Start Address 0x00959768
Stack Init 8f7f0fd0 Current 8f7f09b0 Base 8f7f1000 Limit 8f7ee000 Call 0
Priority 11 BasePriority 8 UnusualBoost 0 ForegroundBoost 2 IoPriority 2 PagePriority 5
ChildEBP RetAddr  Args to Child
8f7f09c8 82a71c15 85b92938 00000000 807c8120 nt!KiSwapContext+0x26 (FPO: [Uses EBP] [0,0,4])
8f7f0a00 82a704f3 85b929f8 85b92938 85b92b00 nt!KiSwapThread+0x266 (CONV: fastcall)
8f7f0a28 82a6a3cf 85b92938 85b929f8 00000000 nt!KiCommitThreadWait+0x1df (CONV: stdcall)
8f7f0aa4 82aad0d6 85b92b00 00000005 00000000 nt!KeWaitForSingleObject+0x393 (CONV: stdcall)
8f7f0abc 82aab117 00000000 00000000 00000000 nt!KiSuspendThread+0x18 (FPO: [3,0,0]) (CONV: stdcall)
8f7f0b04 82a71bfd 00000000 00000000 00000000 nt!KiDeliverApc+0x17f (CONV: stdcall)
8f7f0b48 82a704f3 85b929f8 85b92938 87965ff0 nt!KiSwapThread+0x24e (CONV: fastcall)
8f7f0b70 82a6a3cf 85b92938 85b929f8 00000000 nt!KiCommitThreadWait+0x1df (CONV: stdcall)
8f7f0be8 9af10d75 87965ff0 0000000d 00000001 nt!KeWaitForSingleObject+0x393 (CONV: stdcall)
WARNING: Frame IP not in any known module. Following frames may be wrong.
8f7f0d1c 82a4647a 0012ed84 00000000 00000000 0x9af10d75
8f7f0d1c 00000000 0012ed84 00000000 00000000 nt!KiFastCallEntry+0x12a (FPO: [0,3] TrapFrame @ 8f7f0c
60)
8f7f0ce8 00000000 9af152a2 001b0b8e 0000000f 0x0
More topics to come:
- Calling convention and stack
- 64bit calling convention and stack